Overview
We need to perform the ES benchmark for the following purposes:
Experiment with some configurations of ES for tuning
Compare the performance differences between different versions of ES
Capacity planning for the ES cluster, e.g.
how many nodes does your online ES cluster need?
What is the configuration of each node?
What is the write performance limit of this cluster?
What about read performance?
Several tools are available for performance testing, e.g. esperf, elasticsearch-stress-test or JMeter.
Here we’ll use Elastic official tool esrally, which is a macrobenchmarking framework for Elasticsearch.
Usage
Perform testing
1
2
3
|
$ esrally --track=geonames --target-hosts=localhost:9204 --pipeline=benchmark-only --challenge=append-no-conflicts --report-format=csv --report-file=~/es_benchmarks/result.csv --user-tag="shards:6" --track-params="cluster_health:'yellow',number_of_shards:6,bulk_size:5000"
|
List testing
1
2
3
4
5
6
7
| $ esrally list races
Race ID Race Timestamp Track Track Parameters Challenge Car User Tags Track Revision Team Revision
------------------------------------ ---------------- -------- ---------------------------------------------------------- ------------------- -------- ----------- ---------------- ---------------
31163590-ddbb-40e8-a2a8-e7c2d5fe59da 20200120T195012Z geonames bulk_size=5000, cluster_health=yellow, number_of_shards=16 append-no-conflicts external ec69176
2da942c3-6b1b-4056-93ba-b617819b4e49 20200120T021551Z geonames cluster_health=yellow, number_of_shards=16 append-no-conflicts external ec69176
b7d492eb-37f3-4734-8ab5-e9f23f87341b 20200120T003713Z geonames number_of_shards=6 append-no-conflicts external ec69176
|
Compare results
1
2
3
4
5
6
7
8
9
10
11
12
13
14
15
16
17
18
19
20
21
22
23
24
25
26
27
28
29
30
31
32
33
| $ esrally compare --baseline=2da942c3-6b1b-4056-93ba-b617819b4e49 --contender=31163590-ddbb-40e8-a2a8-e7c2d5fe59da
| Metric | Task | Baseline | Contender | Diff | Unit |
| --------------------------------------------------: | -----------: | ----------: | ---------: | -------: | -----: |
| Cumulative indexing time of primary shards | | 39.8328 | 42.3733 | 2.54053 | min |
| Cumulative indexing throttle time of primary shards | | 0 | 0 | 0 | min |
| Cumulative merge time of primary shards | | 9.66415 | 10.4054 | 0.74123 | min |
| Cumulative merge count of primary shards | | 56 | 134 | 78 | |
| Cumulative merge throttle time of primary shards | | 0.0255833 | 0.01175 | -0.01383 | min |
| Cumulative refresh time of primary shards | | 9.38755 | 10.4285 | 1.04098 | min |
| Cumulative refresh count of primary shards | | 905 | 1672 | 767 | |
| Cumulative flush time of primary shards | | 0.01605 | 0.00281667 | -0.01323 | min |
| Cumulative flush count of primary shards | | 21 | 22 | 1 | |
| Total Young Gen GC | | 67.529 | 71.123 | 3.594 | s |
| Total Old Gen GC | | 6.193 | 7.579 | 1.386 | s |
| Store size | | 3.34169 | 3.33626 | -0.00543 | GB |
| Translog size | | 9.73232e-07 | 0.0140035 | 0.014 | GB |
| Heap used for segments | | 4.85796 | 4.75913 | -0.09883 | MB |
| Heap used for doc values | | 0.164585 | 0.368065 | 0.20348 | MB |
| Heap used for terms | | 3.38647 | 3.11659 | -0.26988 | MB |
| Heap used for norms | | 0.213257 | 0.17749 | -0.03577 | MB |
| Heap used for points | | 0.291598 | 0.292653 | 0.00105 | MB |
| Heap used for stored fields | | 0.802048 | 0.804329 | 0.00228 | MB |
| Segment count | | 279 | 256 | -23 | |
| Min Throughput | index-append | 21224.1 | 20200.1 | -1023.95 | docs/s |
| Median Throughput | index-append | 22499.3 | 21105.1 | -1394.22 | docs/s |
| Max Throughput | index-append | 22846.2 | 22496.8 | -349.333 | docs/s |
| 50th percentile latency | index-append | 1625.08 | 1669.35 | 44.2758 | ms |
| 90th percentile latency | index-append | 2536.77 | 2698.41 | 161.644 | ms |
| 99th percentile latency | index-append | 5182.57 | 6829.08 | 1646.51 | ms |
| 99.9th percentile latency | index-append | 20297.2 | 9961.53 | -10335.7 | ms |
| 100th percentile latency | index-append | 21013 | 10312.9 | -10700.1 | ms |
| error rate | index-append | 0 | 0 | 0 | % |
|
We can also specify another ES to store the result, and compare / visualize in Kibana.
More usage info could be found here.
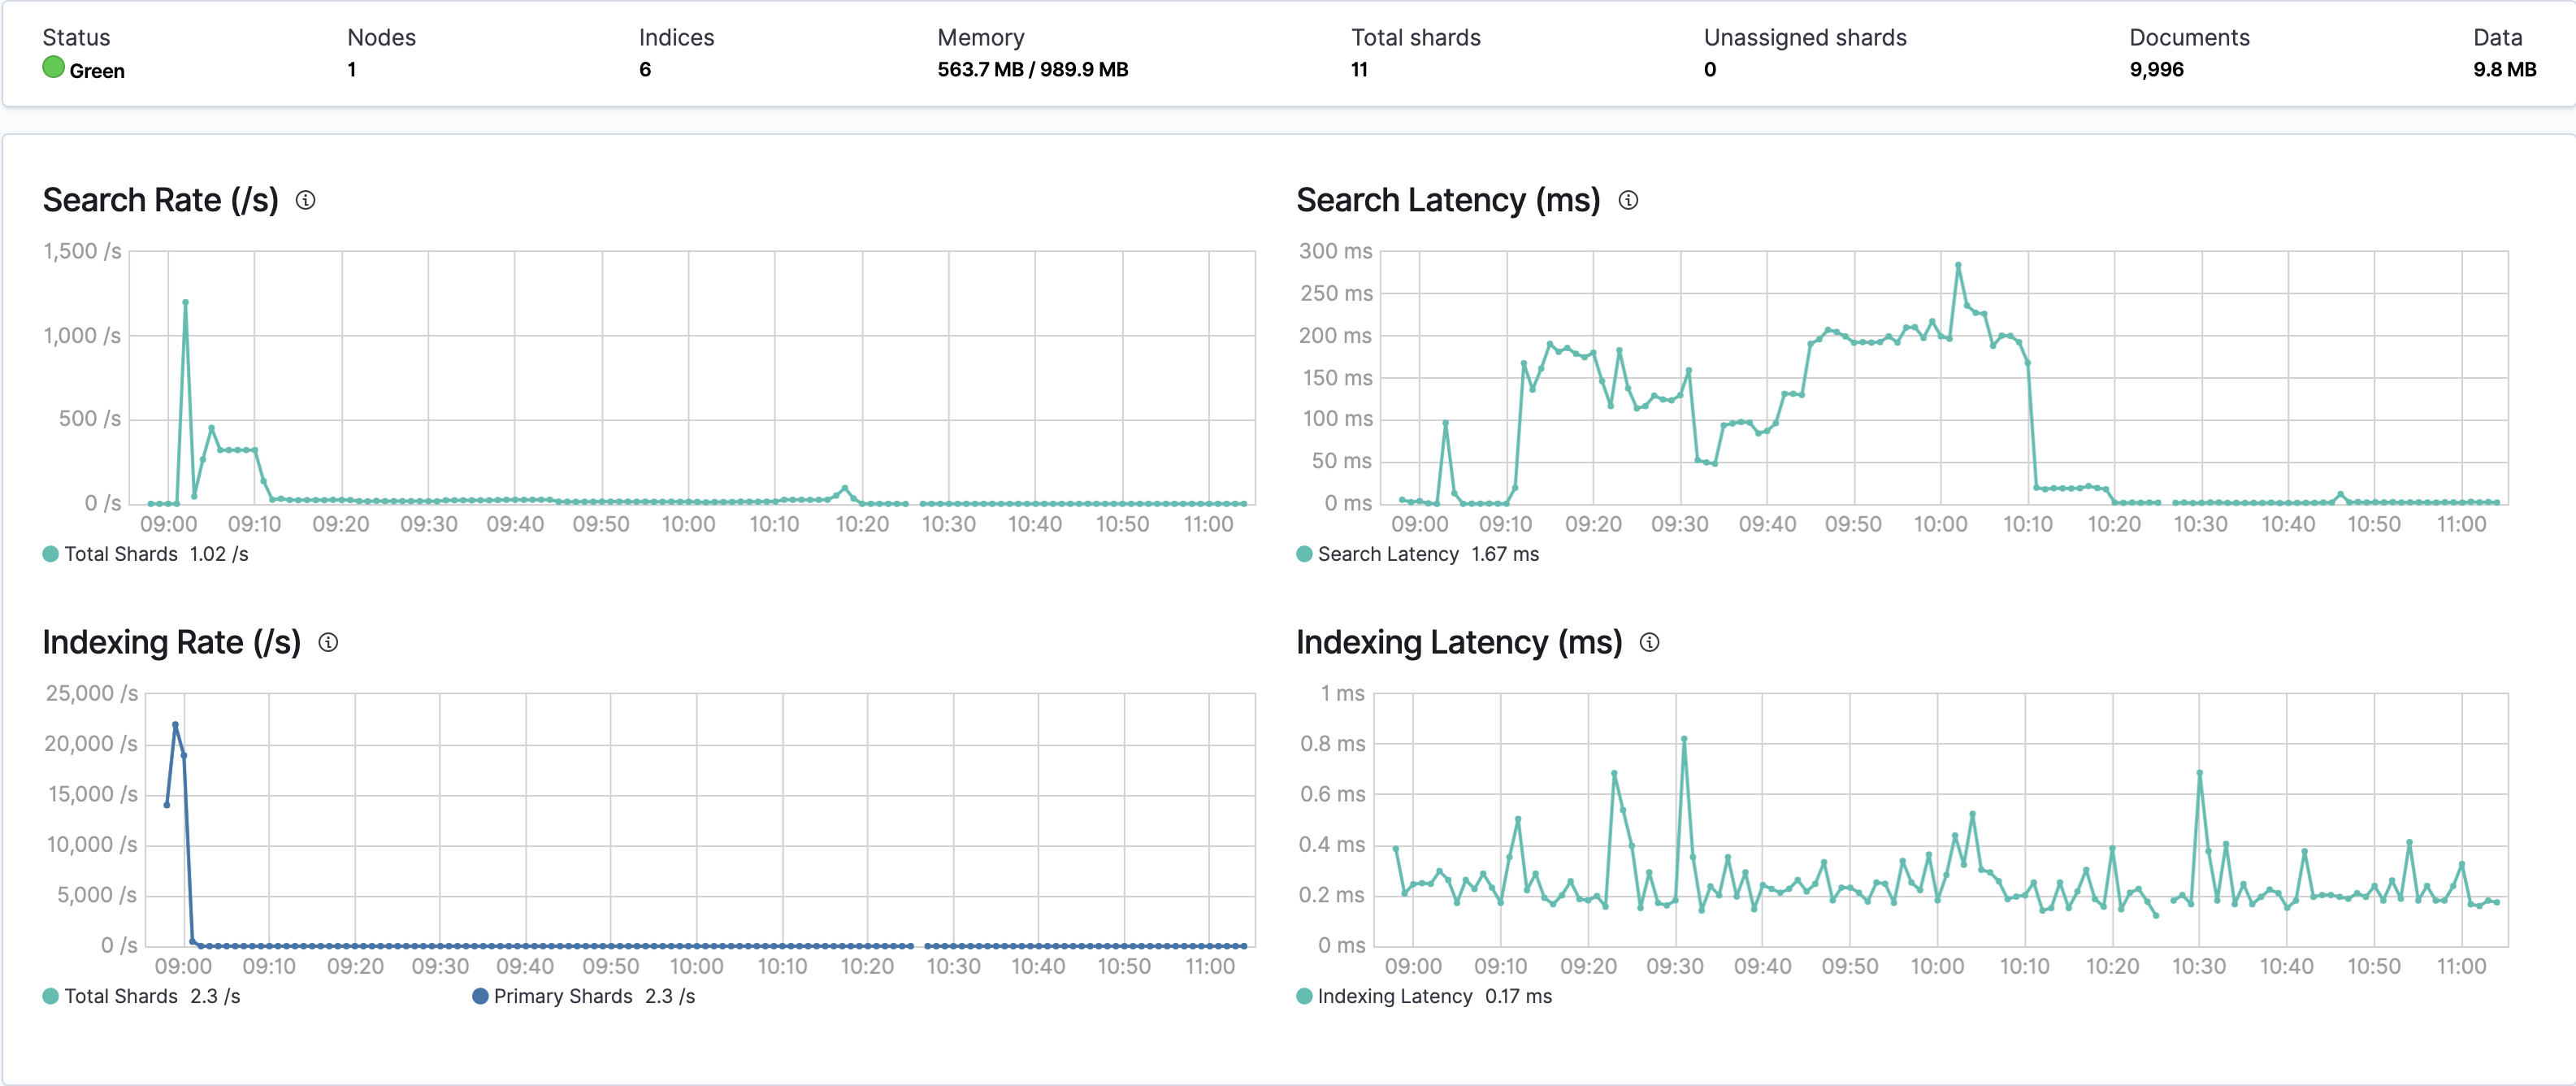
Monitoring
Key Metrics
Throughput: The throughput of each operation, such as index, search, etc.
Latency: response time for each operation
Heap used for X
More info for metrics: summary report
General Metrics from Kibana
![Metrics from Kibana 7]()
Plan
Results will be stored in CSV format, or can be setup and compare in Kibana for better visualization.
Testing
The testing benchmark configurations are coming from Tune for indexing speed and Important System Configrations
References
Rally official doc
Performance Tuning Practice at Ebay
Tune for indexing speed
Important System Configrations
Using Rally to benchmark Elasticsearch queries