We can simply send custom metric to Datadog without any of the DogStatsD client libraries)
Generally DogStatsD creates a message that contains information about your metric, event, or service check and sends it to a locally installed Agent as a collector. The destination IP address is 127.0.0.1 and the collector port over UDP is 8125.
Based on the official doc of Datadog, here’s the raw datagram format for metrics, events, and service checks that DogStatsD accepts:
1 | <METRIC_NAME>:<VALUE>|<TYPE>|@<SAMPLE_RATE>|#<TAG_KEY_1>:<TAG_VALUE_1>,<TAG_2> |
So could use nc and socat on indivial host:
e.g.
1 | # use nc |
To speed up the send period, can reduce the -w timeout to 0 for nc command, but sometimes found that nc -w 0 hung, so started to pipe into socat as an alternative:
1 | # use socat |
Code example
1 | # function to send metric with puppet tags |
Check from Datadog
When metric reporting successfully, we can open Datadog console:
and then search for the metric: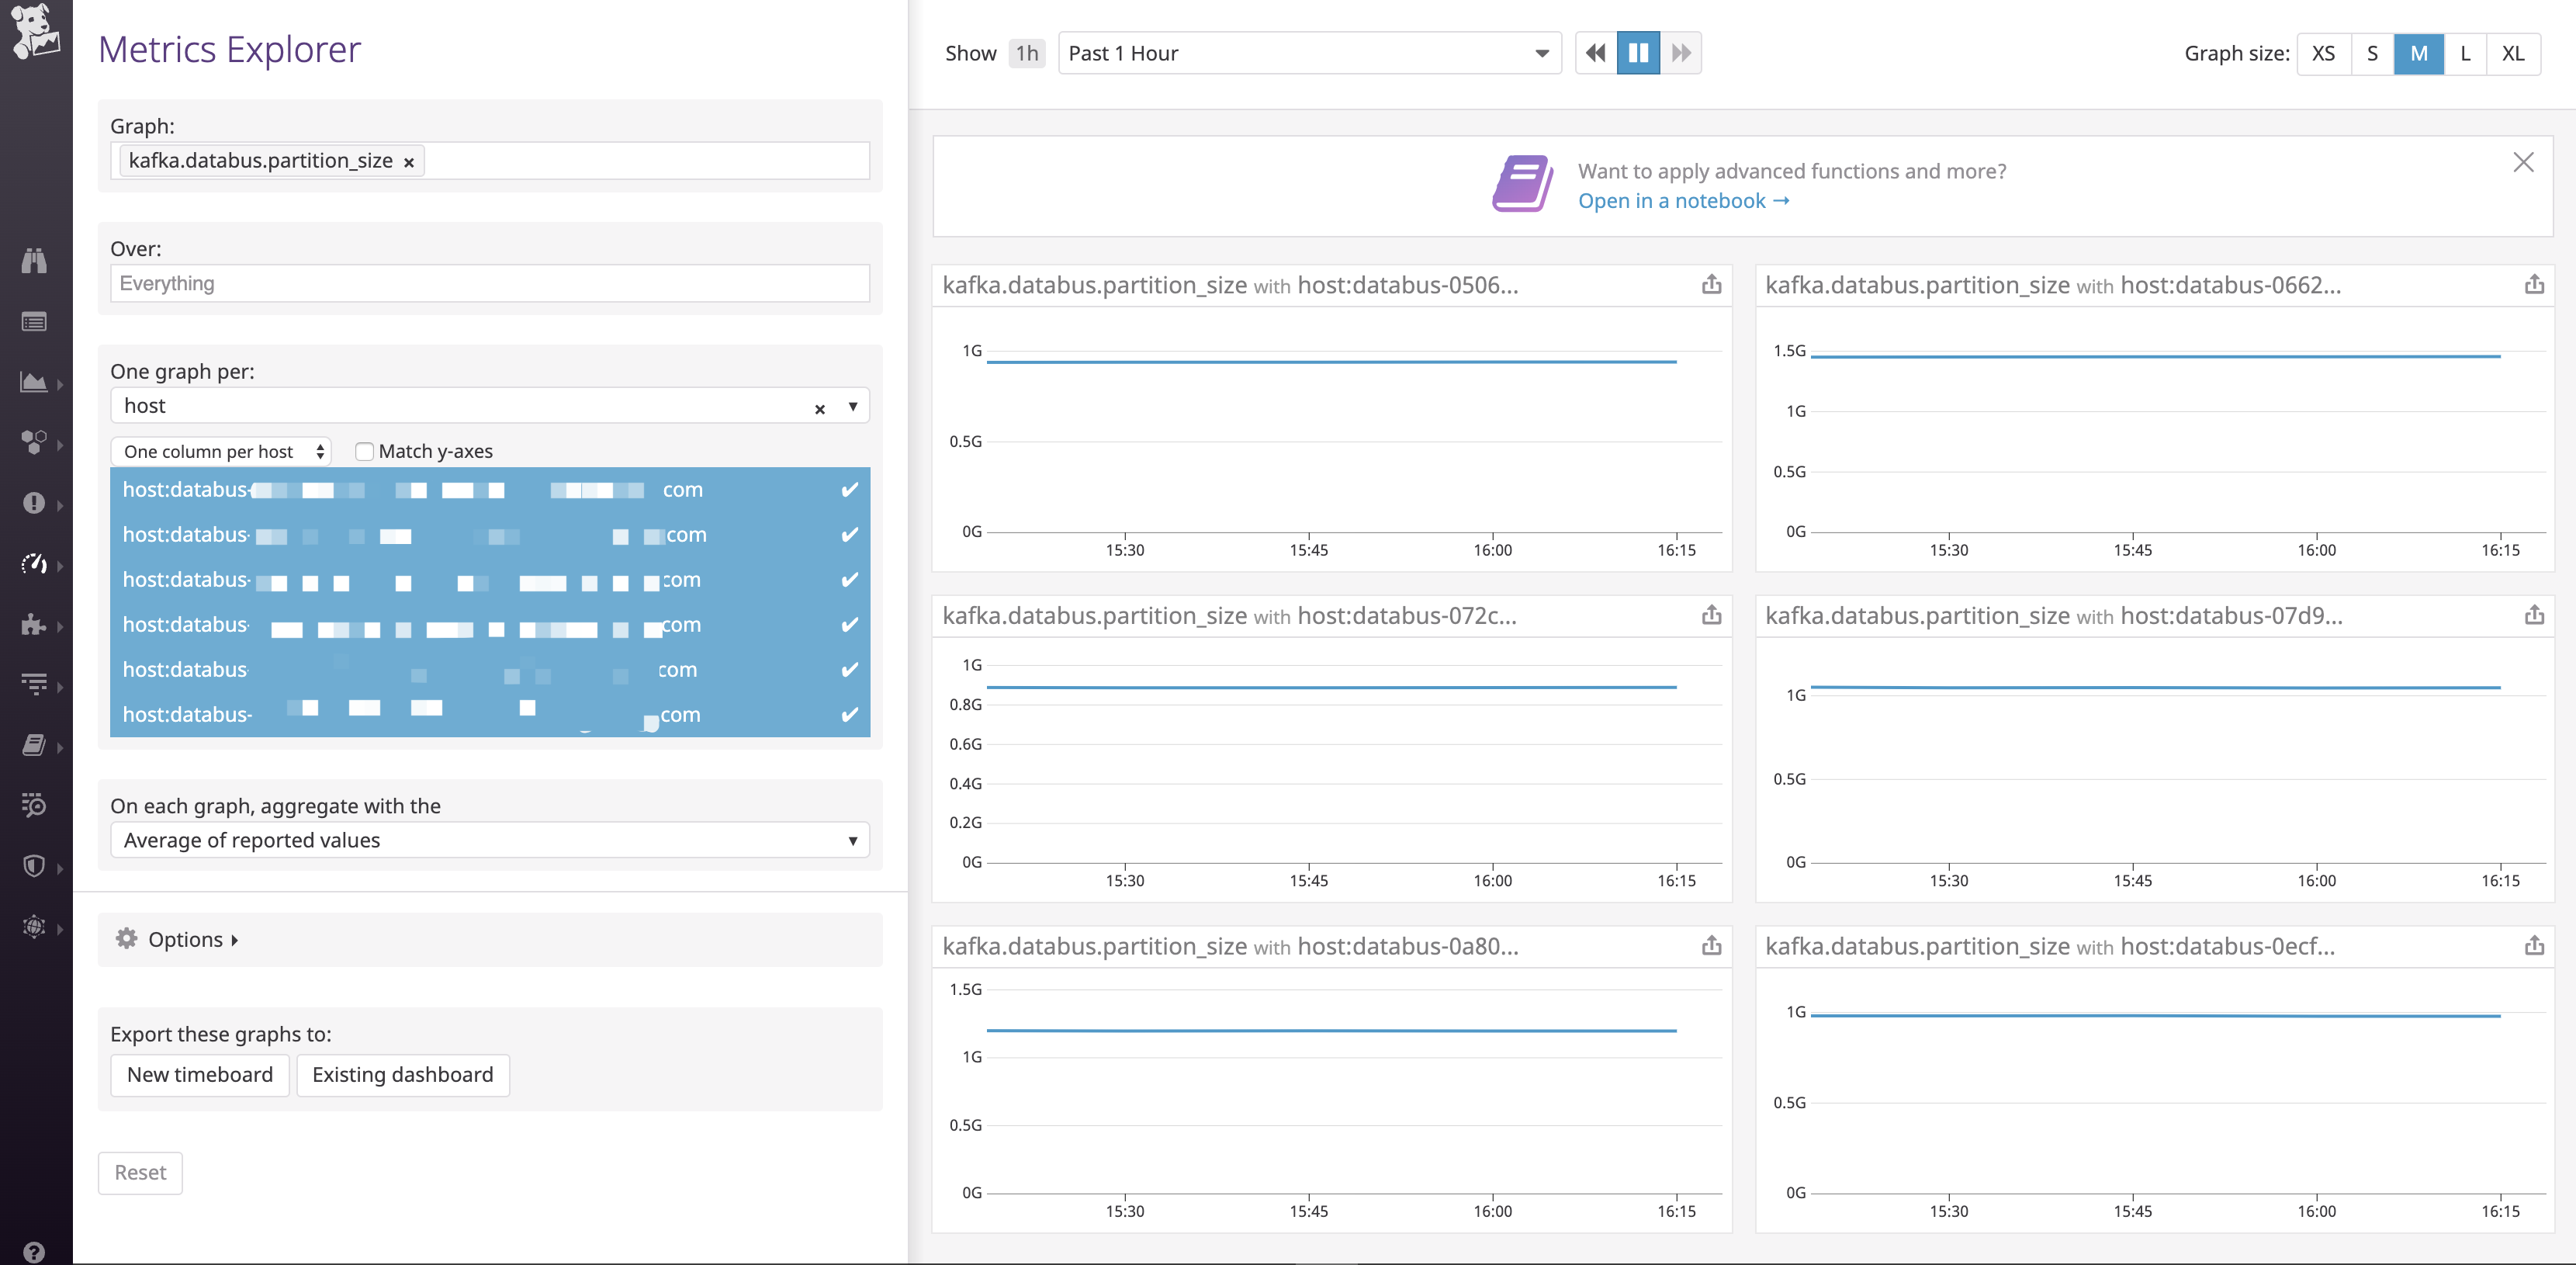
After that we can also create Dashboard and Monitors (with Datadog API or existing Github repo barkdog) when necessary.
Reference
Datadog - sending-metrics
https://gist.github.com/nstielau/966835